Tuesday, March 27, 2012

Lab#3 Wavelength VS Frequency


Spring Wave Lab
The purpose of this lab was to determine a relationship between wavelength and frequency, and if there is a relationship, to determine whether this relationship is linear or not.


A large and long spring was used as a medium to transfer transverse waves. Instead of changing the wavelength by generating many more nodes of standing waves, our group used a different approach. The wavelength was adjusted by changing the length of the spring that was used to generate transverse waves, because λ=2L. We generated transverse standing waves at lengths of 1.5m, 2m, 2.3m and 3m. For each length of spring, we recorded the amount of time that would take for the spring to oscillate 5 times. We repeated this measurement multiple times to get an idea of the uncertainties involved. The data collected and the calculations are below:


Analysis

As mentioned earlier, the wavelength was calculated by multiplying the length of the spring used by two. For example, λ = (1.5m ±0.005m)( 2)= 3m ± 0.01m. The frequency was calculated by using its definition, f=cycles/second. For example, the frequency for the 3m wavelength was calculated as: f = 5 cycles/6.14 ±20s = 0.81Hz ±0.05Hz. Finally, graphing the wavelength verses the frequency gives the graph below:


Conclusion

Looking at the graph, it is clear that there is a linear relationship between frequency and wavelength. As the wavelength is increased, the frequency correspondingly decreases. It is interesting to note that two of the data points are above the trend line, while two are below. The uncertainties relating to the wavelength is due to our ability to correctly measure the spring using a large 2-meter stick, and to correctly hold that measured length during that phase of the experiment. The Uncertainties due to the time per 5 cycles is naturally from our team member’s ability to correctly count and pause the stopwatch each 5 cycles. Finally, the uncertainty related to the frequency is naturally derived from the uncertainties related to the time.

Monday, March 26, 2012

Microwave Experiment


Question: 

A microwave oven is in the back of the class room. We have placed some marshmallows in the microwave to make some measurements of the standing wave. Determine the frequency of this microwave. From this deduce a range of possible dimensions for microwaves including the smallest possible microwave. In this lab we also microwaved a cup of water. What is the total energy content of the captivity? How many photons per second are oscillating in the microwave? What pressure do these photons exert on the side of the microwave?

Data:

Distance between peak energy: 12cm
Estimate mass of water: 100g
Change in water temperature: 37 C 
Dimension of Microwave in W*L*H:  (36 ± 1cm) *(36 ± 1cm)*(23 ± 1cm)

Method:

The measured distance between peak energy also represents the distance between two adjacent anti-nodes. Thus  λ can be calculate by multiplying 2 to the distance.
λ = d * 2
 Since the microwave must contain the entire wavelength, the dimension of the microwave must be a positive integer multiple of the wavelength. 
 width =  m * λ,  length =  n * λ ,    whereas n and m is positive integer
the smallest dimension would be when n and m equal one
The energy in captivity is in direct relationship with the change of temperature
E = mcΔT
The numbers of proton can be find by dividing the total energy in captivity to the energy a proton holds.
Energy of a proton in microwave: E = hf
c = f λ,     f =  λ / c 
Pressure on the side is directly proportional to Poynting vector and speed of light
P = S / c (assuming the microwave is black body)
S ≈ I,      in which I = intensity = power/area
power = E / t  

Calculation:


Monday, March 12, 2012

Experiment 4: Standing Waves


Experiment 4: Standing Waves


The objective of this experiment is to gain knowledge and understanding of standing waves driven by an external force. There are several items that must be obtained before the experiment may be executed. These such items are a Pasco Variable Frequency Wave Driver, a weight which will be calculated using the mass, a meter stick for measuring the length of the string, a pulley and a pendulum clamp.

The main idea behind this entire lab is to find a relationship between the amount of nodes and antinodes, and as well as the frequency given by these nodes. It is clear to see that a higher frequency will create more nodes and antinodes.


This was used with a 123 centimeter string and clearly shows that the frequency increases as the nodes and anti nodes increase. There will always be one more node than antinode on any given wave.

Velocity = Frequency X Wavelength

Wavelength = 2(Length) / n

Velocity = sqrt(Tension / mass per unit length)
The tension in the string was calculated by simply determining the weight on it which in this case was 200.2 grams multiplied by the downward force of gravity at 9.8 m/s^2. The weight of the rope was determined by putting a set amount of length on the scale and then multiplying it by the length to determine how much the weight of the string was.

Sunday, March 4, 2012

Experiment #2: Fluid Dynamics


Experiment #2: Fluid Dynamics

Objective:  By measuring the time for certain volume of water to leave the bucket through a small hole, we aim to compare the experimental results with the theoretical results generated from the Bernoulli Equation and the Continuity Equation.


Equations:
Bernoulli Equation:   


Experiment:


1. Obtain the predesignated bucket from the instructor
2. Measure the diameter of the hole and block the hole with tape
3. Level it up with wooden blocks and fill the bucket with 3 inches of water above the hole
4. The volume needed to be emptied is 16 ounces = 473 mL
5. The following is the time to empty for all 6 trials:


Procedural
In this experiment, a bucket with a small hole, bottle with marks, ruler, stopwatch, and some other tools were used.  First, after stopping water come out from the bucket, the height of water was measured to as requested, 3 inches. Then the water was released to flow into the beaker and fill beaker with the assigned volume. When the flowing water reaches the volume, the stopwatch was used to record the reaching time of water. This same process has to be applied six times, and the average taken time will be obtained from these six trials. With the time being obtained and the diameter of the hole being measured, the formula "theoretical time = volume/area*radical(2*gravity*height)" was applied. This formula will then rearranged so the diameter of the hole could be calculated by using this formula. Overall, this experiment was designed for students to get the diameter of the hole on the bucket after recording the time taken for water to flow.


Filling the beaker to 16 ounce.


using the equation given to me t_theoretical = V/A(2gh)^1/2

i gotten the theoretical time to be about 18.189 and 22.25 to be the min and max of the uncertainties.
which is about 10% error, which is pretty close.
using an error equation
                                               (t_actual -t_theoretical) /t_actual

analysis
     from this experiment, we can concluded that that knowing the pressure we can find the speed of the water flowing through the bottom of the bucket. if we know the height of the water, and how much water is in the cup after, as well as the time it took.


Thursday, March 1, 2012

Experiment 1 :Fluid Statics(Feb 28,2012)

Purpose
The purpose of this lab was to try a variety of measurement methods in order to determine an experimental buoyant force value.

Materials
Force Probe, String, Overflow Can, Beaker to Catch Overflow, Metal Cylinders, Meter Stick, Ring Stand, Calipers

#1 Cup pressure test
#2 Act A : Cylinder submerged in water

#3 Act B: Measure the volume of the water overflowed

Under Water Weighting Method
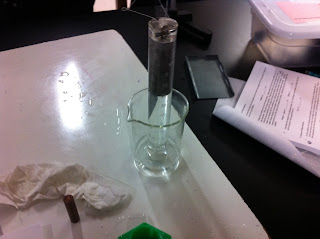
We tied the metal cylinder to a piece of sting (after weighing the metal cylinder) and tied the other end to a force probe so that we could get a measurement of the tension of the object when we submerged it through the force probe. We then obtained a ring stand and hung our force probe from it so that we could get a less varying result.  We submerged the hanging mass in our canister of water and used the formula Buoyancy Force = Weight - Tension to find a Buoyancy force of approx. 1.67 N.


Displaced Fluid Method
We prepared a overflow can and an additional container to catch spill over water. We then placed the full overflow can on the edge of the table and held the beaker underneath.  After slowly lowering the metal cylinder into the can of water and catching all of the spill over water we measured the weight of the spill over water which using Archimede's principle is equal to the buoyancy force 1.035 N


#4 Act B: Measure the volume of the water overflowed


Volume of Object Method
The last method we used is we determined the volume of the object which would also be the amount of water displaced when we inserted it to the overflow can. Thus we could find the weight of the displaced water by taking the volume of the object and multiplying the density of water. And using the Archimede's principle we can be sure that the two values are the same after conversion 1.01 N


#4 Act C: Measure the height of the cylinder


Questions:

1. The errors can be happen in the tolerance during the measuring and dropping water.

2. I believe that the Underwater Weighing Method is the most accurate one. Regarding to the method, tolerance could be reduced and the is no dropping water since the cylinder submerged in the water.

3. If the cylinder touches the bottom of the water container, the buoyant force would have been low. It is because the container's bottom proved a supporting force to the cylinder which reduce the buoyant force.